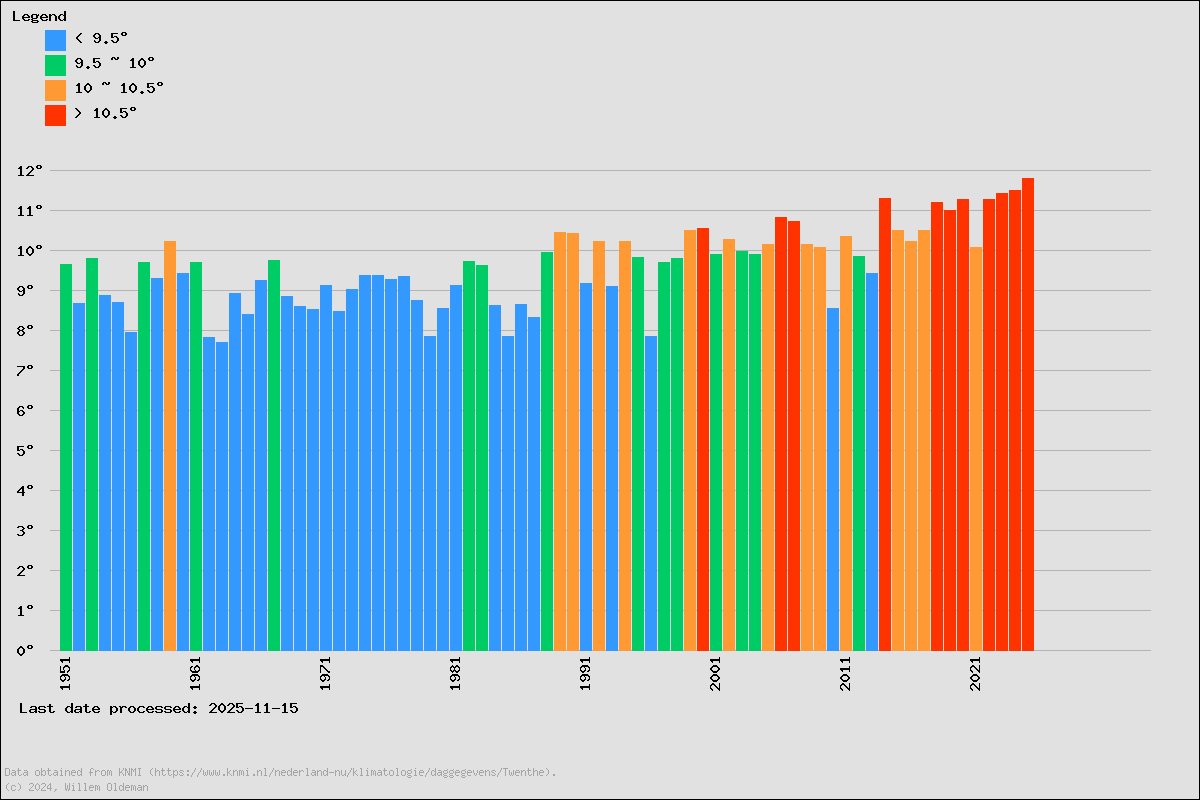
Below is the average temperature graph for Enschede - the Netherlands
Please note: The last bar may overshoot or undershoot, because the year is not completed yet
Click on a temperature bar to see the monthly details for that year
If the date in the graph is off, try visiting this page using Private Browsing. The image may be cached by your browser.
Questions, remarks... Please contact me at "w h a <dot> oldeman at gmail <dot> com"
Remove the spaces and replace <dot> with a dot... An attempt to reduce spam
This is a spare time project, I may not answer immediately